
Tableau Course in Mumbai
Expert-lead Training
Discover the potential of data visualization by enrolling in our in-depth Tableau course in Pune. Acquire practical expertise and become skilled in data storytelling methods. Advance your career with useful knowledge and skills that are applicable to the industry.


Our Services
Course Information
Comprehensive details about course content, structure & objectives.
1-on-1
Training
Training that is specifically customized to meet each student's needs.
Classroom Training
Live interactive sessions on the course with experienced instructors.
Online
Guidance
Flexible virtual support for effective remote and distant learning.
Key Notes
Key Features
Key Features
Key Features
Key Features
Key Features
Key Features
Expert Faculties: Learn from seasoned professionals with extensive industry experience and knowledge.
Placement Support: Comprehensive career guidance and job placement assistance to ensure students secure their desired job roles.
Resume Building: Craft impressive resumes to highlight your skills and achievements effectively.
Real-Time Project: Engage in practical projects to apply data science concepts in real-world.
Guaranteed Certification: Earn a recognized certification upon successful course completion.
Experience Alteration System: Experience real-world projects and hands-on training, ensuring you are job-ready.
What is Tableau?
Tableau is a leading data visualization tool used for transforming raw data into an understandable format. It allows users to create interactive and shareable dashboards, making it easier to analyze and gain insights. If you’re looking to expertize this powerful tool, our Tableau course in Mumbai offers in-depth training and practical experience. Enroll in our Tableau course training in Mumbai to advance your data analysis skills and elevate your career prospects.

Who Can Apply for Tableau Course?
- Data Analysts looking to enhance their visualization skills.
- Business Intelligence Professionals aiming to improve their reporting capabilities.
- IT Professionals seeking to add a valuable skill to their repertoire.
- Students and Graduates interested in pursuing a career in data analytics.
- Professionals from Any Industry who want to leverage data for better decision-making.

Interview Q&A
Tableau is a data visualization tool used for converting raw data into interactive and shareable dashboards.
Filters are used to restrict data displayed in the view based on specific conditions.
Dimensions are qualitative data, while Measures are quantitative data.
A Tableau Workbook is a file containing sheets like dashboards, stories, and individual worksheets.
A Tableau Story is a sequence of sheets or dashboards used to convey information.
7. Explain Tableau Data Extract (TDE).
A Tableau Data Extract (TDE) is a snapshot of data optimized for improved performance and offline analysis.
8. What is the difference between a Live connection and an Extract?
A Live connection connects directly to the data source for real-time updates, while an Extract is a snapshot of data for faster performance.
9. What are Sets in Tableau?
Sets are custom fields that define a subset of data based on conditions.
10. Define Blending in Tableau.
Blending in Tableau is combining data from different sources within Tableau.
11. What is a calculated field in Tableau?
A calculated field is a new field created by applying a calculation to existing fields.
12. What is the use of the Show Me feature?
The Show Me feature helps choose the best visualization type for selected data.
13. Explain Parameters in Tableau.
Parameters are dynamic values used to replace constant values in calculations, filters, and reference lines.
14. What is Aggregation and Disaggregation in Tableau?
Aggregation summarizes data (e.g., SUM, AVG), while Disaggregation shows all data points individually.
15. What is the purpose of the Page Shelf?
The Page Shelf allows you to break a view into a series of pages for better analysis.
16. What are Hierarchies in Tableau?
Hierarchies are groupings of related dimensions to enable drill-down analysis.
17. Explain Dual-axis in Tableau.
Dual-axis is using two independent axes layered over each other to compare measures.
18. What are Actions in Tableau?
Actions are interactive elements in dashboards that allow for dynamic updates and navigation.
19. What is a Gantt Chart in Tableau?
A Gantt Chart is a type of bar chart that represents a project schedule.
20. How do you perform performance tuning in Tableau?
Performance tuning in Tableau involves optimizing data extracts, reducing the complexity of calculations, and improving data connections.
Why should you learn the Tableau Course in Mumbai?
Learning the Tableau course in Mumbai offers numerous advantages. By enrolling in a Tableau course in Mumbai, you’ll gain essential skills in data visualization and analytics, crucial for making data-driven decisions in today’s data-centric world. Tableau Course Training in Mumbai provides hands-on experience with the latest tools and techniques, making you proficient in creating impactful visualizations and dashboards. This training can significantly advance your career prospects and make you a valuable asset to potential employers.
How can we help you learn the Tableau course In Mumbai?
We can assist you in completing the Tableau course in Mumbai by offering thorough and hands-on instruction that will provide you the fundamentals of data visualization. Our Tableau course is designed to ensure that you have a thorough understanding of how to use Tableau for data analysis. It covers everything from fundamental ideas to complex approaches. With practical assignments, real-world situations, and knowledgeable instructors, you will be prepared to manage a variety of data issues and produce attractive dashboards.
Beginners and experienced experts will find our Tableau Course Training in Mumbai to be highly adapted to their needs. To improve your learning process, we provide complete course of study, individualized help, and engaging sessions. Selecting our training program will give you access to a course that prioritizes real-world application, allowing you to put what you have learned to use right away in your academic or professional job.
Tableau Course Syllabus
The Tableau course syllabus includes data connection, preparation, and visualization techniques. You’ll learn to create interactive dashboards, use calculated fields, and optimize performance. Hands-on practice with real-time data and advanced features ensures a thorough understanding of Tableau.
Our Top Recruiters





Placement Lifecycle
Eligibility Criterion
Interview Question & Answer
Resume and LinkedIn Formation
Mock Interviews
Scheduling Interviews
Job Placement
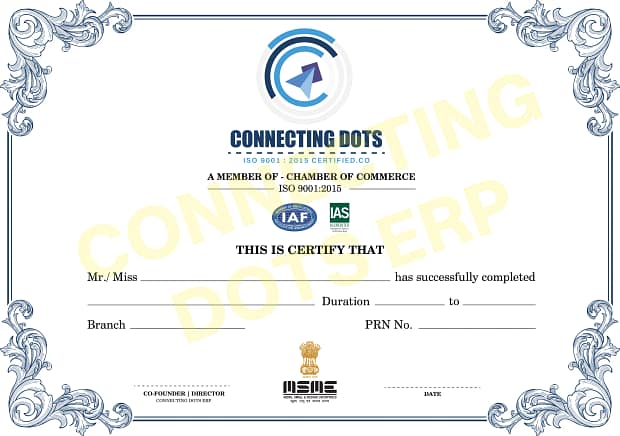
Tableau Course Training Certificate in Mumbai
Are you seeking certification in IT training?
Our institute offers leading IT courses and provides certification in various IT fields, equipping you with the crucial skills and credentials needed to advance your career and stay competitive in the global tech market. Achieving this certification can greatly enhance your career opportunities, showcasing your expertise and readiness to tackle real-world IT challenges effectively.
FAQs
Basic knowledge of data handling and familiarity with Excel is recommended.
The course duration typically ranges from a few weeks to a couple of months, depending on the training provider.
Yes, most Tableau courses offer a certification upon successful completion of the program.
Yes, the course includes practical exercises and projects to help you apply what you've learned.
Completing the course can enhance your data visualization skills, making you more competitive in data analysis roles and opening up new career opportunities.
Student Reviews
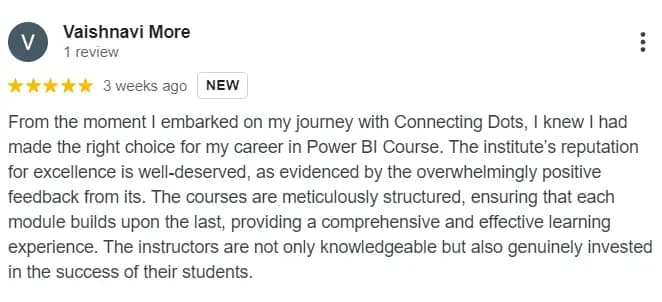

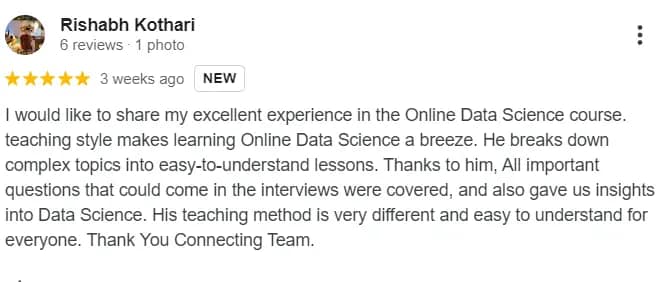
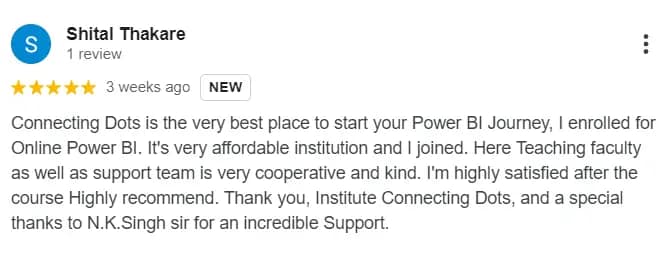
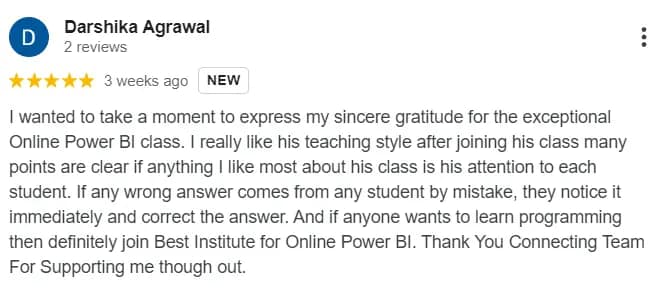
Tableau Course in Mumbai With 100% Placement
The Tableau course in Mumbai with a 100% placement guarantee stands out as an exceptional opportunity for aspiring data scientists. This program is meticulously designed to equip students with in-demand skills and practical experience, ensuring they are industry-ready.
Get Industry-Ready with Dedicated Career Support:
- Industry-Ready Advanced Curriculum: Covering essential topics such as machine learning, big data analytics, data visualization, and more.
Certificate from - Connecting Dots ERP: Gain a recognized certification that enhances your professional credibility.
Expert Faculty: Learn from industry professionals with extensive experience and knowledge. - Interview Opportunities with Leading Companies: Access exclusive job interview opportunities with top companies.
- Dedicated Placement Assistance: Benefit from personalized support to help secure your ideal job.
- Real-World Case Studies: Engage in hands-on projects and case studies that provide practical exposure.
Connecting Dots ERP provides training for IT courses like Data Science, Power BI , TABLEAU , Full Stack Python, Salesforce, Digital Marketing , Angular JS , AWS , DevOps , Azure and Software Testing.
Tableau Training in Mumbai
Tableau Certification Training locations in Mumbai : Tableau Course in Mumbai, Tableau Course Fees in Mumbai, Tableau Course in Thane, Tableau Course in Kalyan, Tableau Course in Bhandup, Tableau Course in Khopoli, Tableau Course in Titwala, Tableau Course in Ulhasnagar, Tableau Course in Vashi, Tableau Course in Badlapur, Tableau Course in Ghatkopar, Tableau Course in Aroli, Tableau Course in virar, Tableau Course in ambarnath, Tableau Course in Kurla, Tableau Course in Diva, Tableau Course in Mulund, Tableau Course in Matunga, Tableau Course in nerul, Tableau Course in dadar, Tableau Course in andheri, Tableau Course in navi mumbai, Tableau Course in powai, Tableau Course in ghansoli, Tableau Course in dombivali, Tableau Course in bhiwandi, Tableau Course in mulund, Tableau Course in bandra, Tableau Course in Borivali.
Still have queries? Let’s Connect
Contact US
Pune:
Call us at: 9004002958, 9004002941, 9004008313
Call us at: 7517542233, 9004001938, 8805563870
Pune:
Call us at: 9004002958, 9004002941, 9004008313
Call us at: 7517542233, 9004001938, 8805563870
